Querying Application Insights for data visualisation
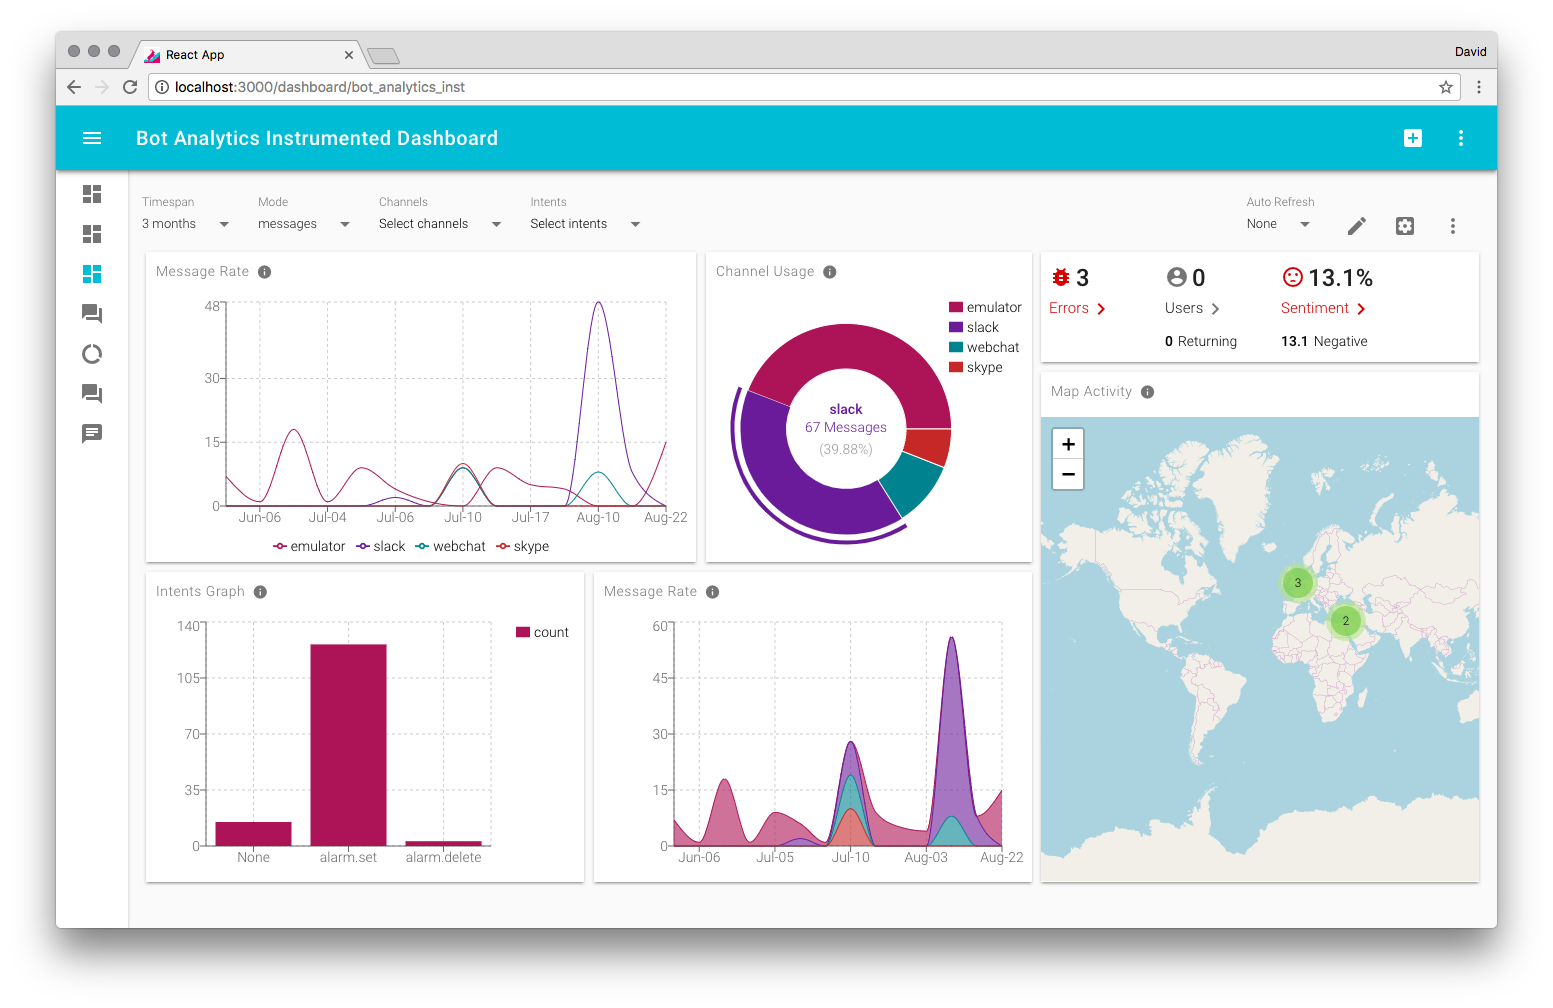
Ibex dashboard is an open source web app for displaying telemetry data from Application Insights. It comes with a number of sample templates including analytics dashboards for Bots. If you’re developing a bot and you want to see how your bot is performing over time then you can select the Bot Instrumentation template which requires you to enter your Application Insights App Id and App Key. Also depending on your bot you will need to add Node.js instrumentation or C# instrumentation in order to enable logging to Application Insights. Then after a couple of minutes you will start to see the data come through! The dashboard can be completely customised using generic components including charts, tables, score cards and drill-down dialogs. These elements can be used to review how your bot performs over time, monitor usage stats, message sentiment, user retention and inspect user intents.
If you are new to Application Insights one of the useful features of the Ibex dashboard is the ability to inspect an element’s Application Insights query and the formatted JSON data side by side.
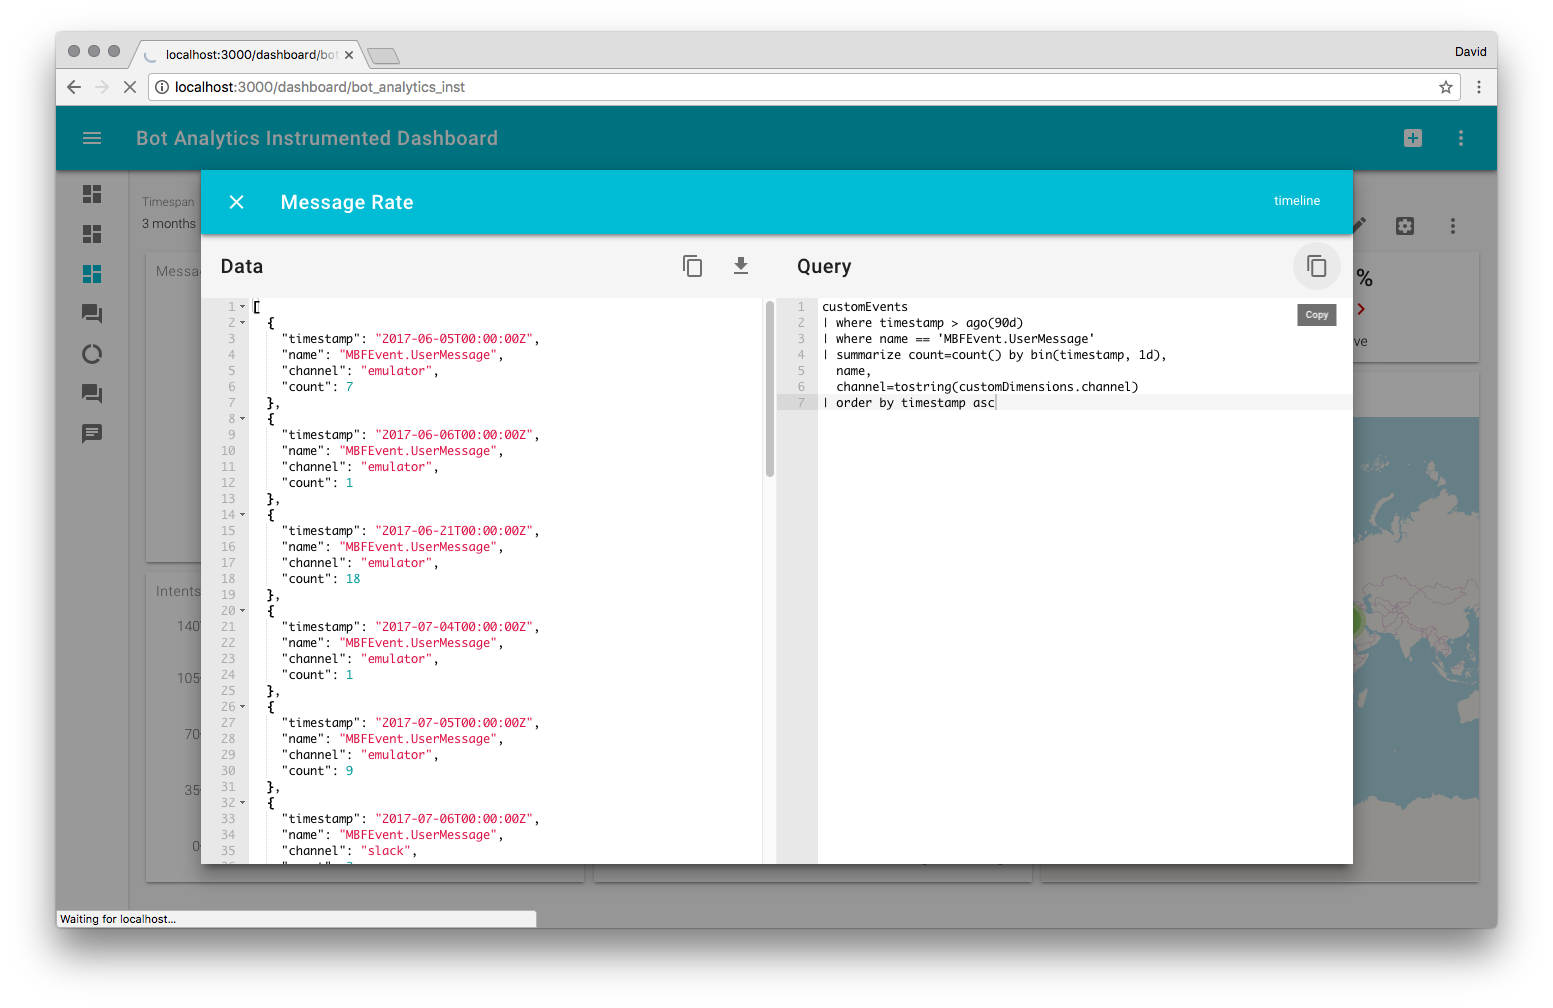
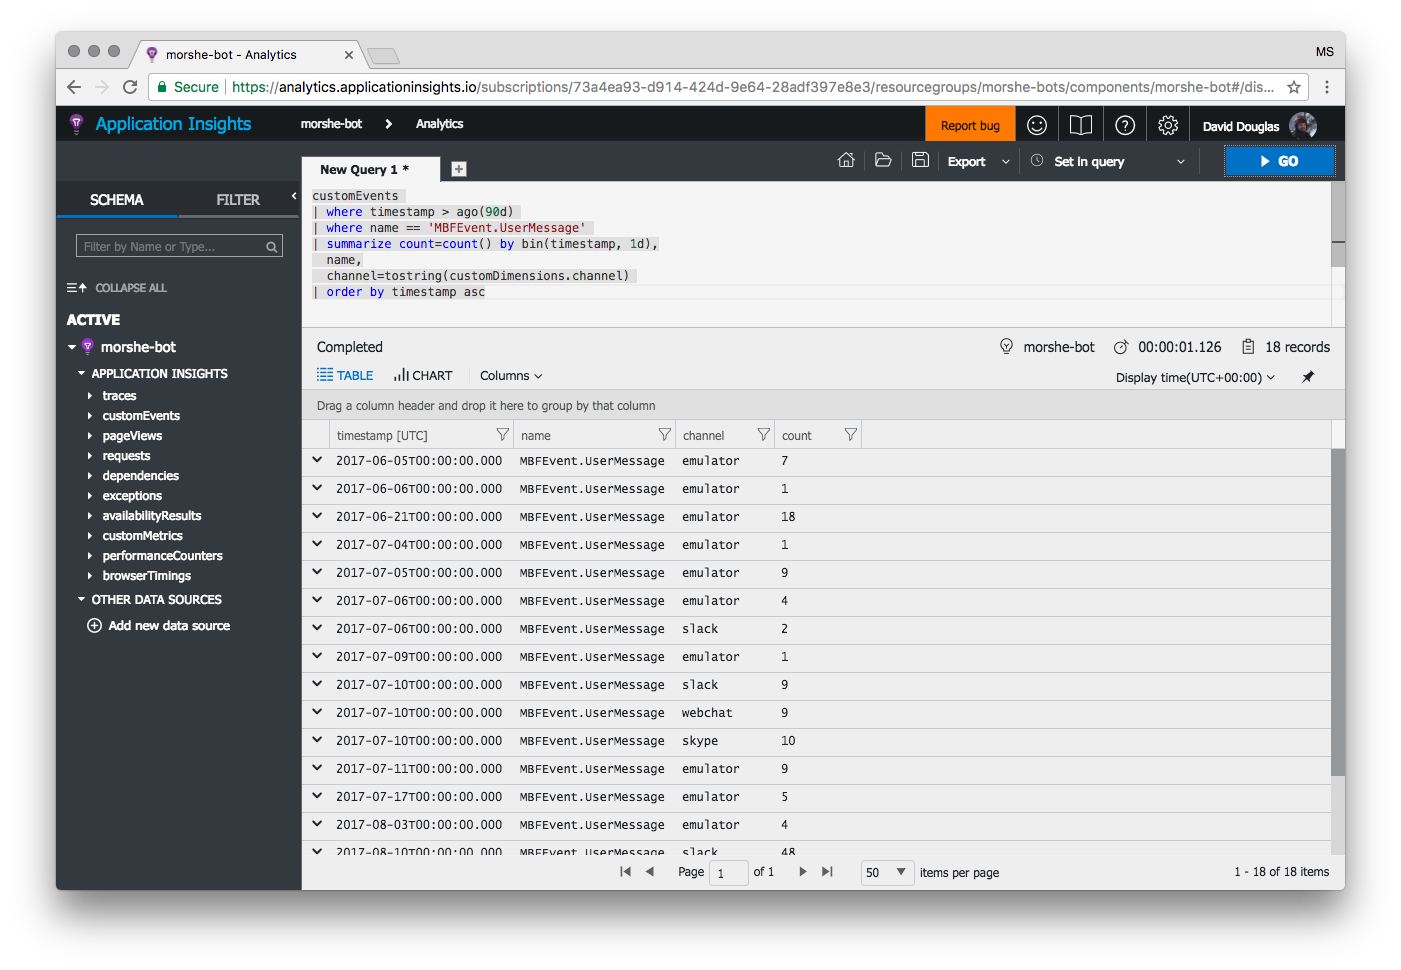
This query can be copied and played back inside your Application Insights live code editor. This is a good way to learn how the Application Insights queries work as you can step through the query by commenting out various lines with double slashes ‘//’.
Writing Azure Log Analytics queries for Ibex dashboard
The Ibex dashboard schema is composed of meta data, data sources, filters, elements and dialogs. Each data source allows you to define a query and a ‘calculated’ javascript function to process the query’s results for display purposes. Before learning to write Application Insights queries I was used to writing javascript map / reduce functions to aggregate data and so it’s all too easy to rely on previous javascript knowledge to process the data from a basic query. But often this javascript ‘reduce’ aggregation logic can done in an Application Insights query with a lot less effort. So invest some time up front to learn the key Application Insights query concepts and it will pay off in the long run!
To help to illustrate this we can look at the Application Insights query for tracking a bot to human hand-off during a user’s conversation session. For this scenario we built a QnA bot with the hand-off module installed. If a customer asks the QnA bot a question and no answer was found in the knowledge base we trigger an automatic hand-off to human. We want to show the fastest, longest and average times for customer waiting for an human agent to respond in the dashboard.
We can start by writing a basic query in Application Insights to get all the transcripts from the ‘customEvents’ table and ‘project’ only the information we need.
customEvents
where name == 'Transcript'
| extend customerName=tostring(customDimensions.customerName),
  text=tostring(customDimensions.text),
  userTime=tostring(customDimensions.timestamp),
  state=toint(customDimensions.state),
  agentName=tostring(customDimensions.agentName),
  from=tostring(customDimensions.from)
| project from, text, customerName, agentName, state, userTime
| order by userTime asc
But in this example we are not using Application Insights to aggregate the results so we end up with a lot of results to process. Given the query above the following code snippet is the amount of Javascript required.
calculated: transcripts => {
  const key = "customerId";
  const transcriptsGrouped = transcripts.reduce((a, c) => {
    const i = a.findIndex(col => col.id === c[key]);
    if (i === -1) {
      let collection = {
        id: c[key],
        transcripts: []
      };
      a.push(collection); // new group
    } else {
      a[i].transcripts.push(c); // append to group
    }
    return a;
  }, []);

  const SEC_PER_DAY = 86400; // 60 * 60 * 24;
  let times = [];

  transcriptsGrouped.forEach(userTranscript => {
    let prevTranscript = null;
    userTranscript.transcripts.forEach(transcript => {
      if (
        prevTranscript &&
        prevTranscript.state === 1 &&
        transcript.state === 2
      ) {
        let date1 = new Date(prevTranscript.userTime);
        let date2 = new Date(transcript.userTime);
        let diff = (date2 - date1) / SEC_PER_DAY;
        times.push(diff);
      }
      prevTranscript = transcript;
    });
  });

  const avgTimeWaiting =
    times.reduce((a, c) => {
      return a + c;
    }, 0) / times.length;
  const maxTimeWaiting = Math.max(...times);
  const minTimeWaiting = Math.min(...times);

  return {
    "transcriptsAverageTimeWaiting-value": avgTimeWaiting.toFixed(2),
    "transcriptsLongestTimeWaiting-value": maxTimeWaiting.toFixed(2),
    "transcriptsShortestTimeWaiting-value": minTimeWaiting.toFixed(2)
  };
};
The first ‘reduce’ block is required to group the transcripts per user Id. Then for every user we track the state change from waiting and talking to human agent and calculate the time difference in seconds. Where ‘state’ is an integer value that marks the current status of the conversion.
0 = Bot 1 = Waiting 2 = Human agent
But we can optimise the code by doing the aggregation within the Application Insights query by using the ‘summarize’ operator and ‘count’ function.
customEvents
where name == 'Transcript'
| extend conversationId=tostring(customDimensions.userConversationId),
  customerId=tostring(customDimensions.customerId),
  state=toint(customDimensions.state)
| where state==1 or state==2
| order by timestamp asc
| summarize total=count(), times=makelist(timestamp) by conversationId, customerId, bin(state, 1)
| project conversationId, customerId, state, startTime=times[0]
| summarize result=count(state), startEndTimes=makelist(startTime) by conversationId, customerId
| where result == 2
| project conversationId, customerId, timeTaken=todatetime(startEndTimes[1])-todatetime(startEndTimes[0])
Notice how you can apply aggregations in multiple passes, in this case the ‘summarize’ operator and ‘count’ function is used to aggregate results twice in conjunction with multiple ‘where’ statements that are used to filter the results. Now the javascript ‘calculated’ function code can be greatly simplified:
calculated: results => {
  const times = results.reduce((acc, cur) => {
    // converts time hh:mm:ss format to value in seconds
    acc.push(
      cur.timeTaken
        .split(":")
        .reverse()
        .reduce((a, c, i) => a + c * Math.pow(60, i), 0)
    );
    return acc;
  }, []);

  const avgTimeWaiting = times.reduce((a, c) => a + c, 0) / times.length;
  const maxTimeWaiting = Math.max(...times);
  const minTimeWaiting = Math.min(...times);

  return {
    "transcriptsAverageTimeWaiting-value": avgTimeWaiting.toFixed(2),
    "transcriptsLongestTimeWaiting-value": maxTimeWaiting.toFixed(2),
    "transcriptsShortestTimeWaiting-value": minTimeWaiting.toFixed(2)
  };
};
The only thing we do is a ‘reduce’ function to convert the time format ‘hh:mm:ss’ returned from the Application Insights query into a number of seconds for the various calculations for displaying in a score card element.
The final Application Insights query is available in the hand-off to human dashboard template and is included with Ibex dashboard.