Making sense of web app debug logs on multiple Android and iOS devices
If you’ve ever needed to debug Cordova web apps on iOS and Android it can be quite an awful experience for a web developer. Since working on Postcard web app I’ve found a couple of neat tips to help make sense of those noisy debug logs.
From localhost to native land
Designing and developing in localhost is familiar territory to web developers and so it makes sense to try and get as much work done there as possible. But when you need to use the physical hardware features of a mobile platform the only way to see if things really work is to go native.
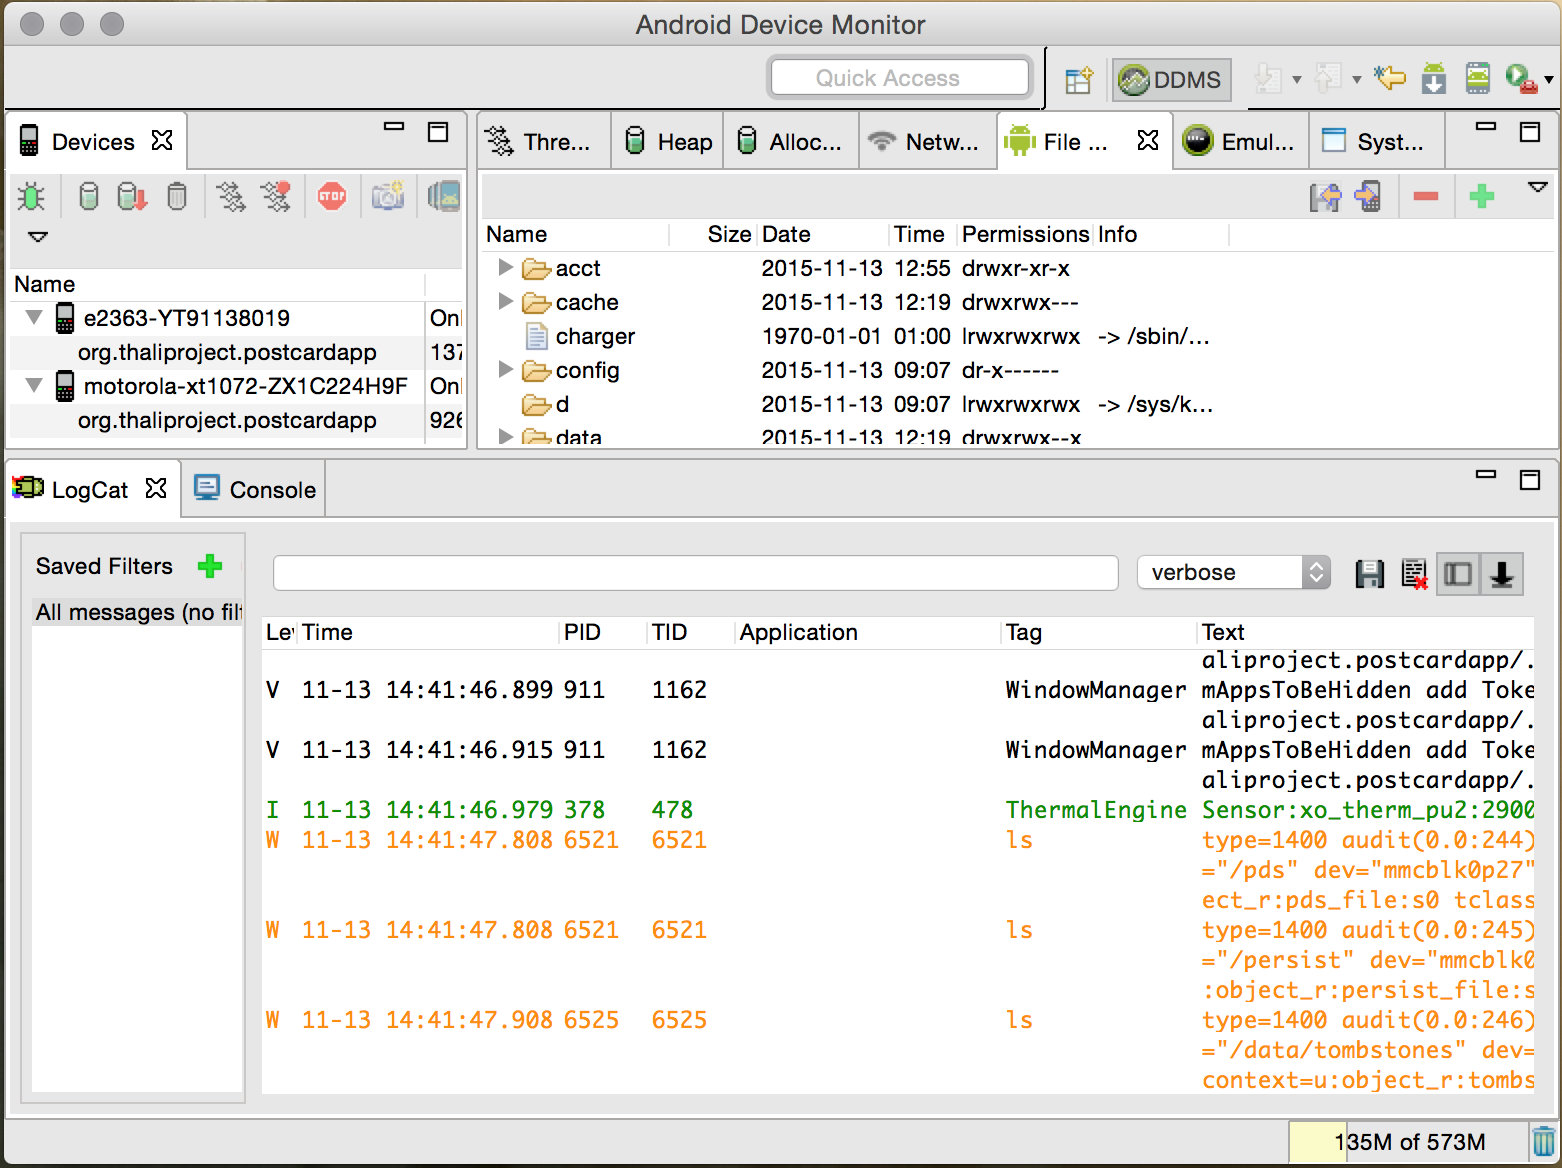
For Cordova app development on Android there are a few ways to debug web apps but usually it’s a case of cordova build android then cordova run android --device --debug. Then if you have setup Android SDK’s PATH environment var you can run monitor in command line to open up the Android Device Monitor app to see all the logs.
For Cordova app development on iOS it’s usually cordova build ios in Terminal and then you just open the project in Xcode to debug the app.
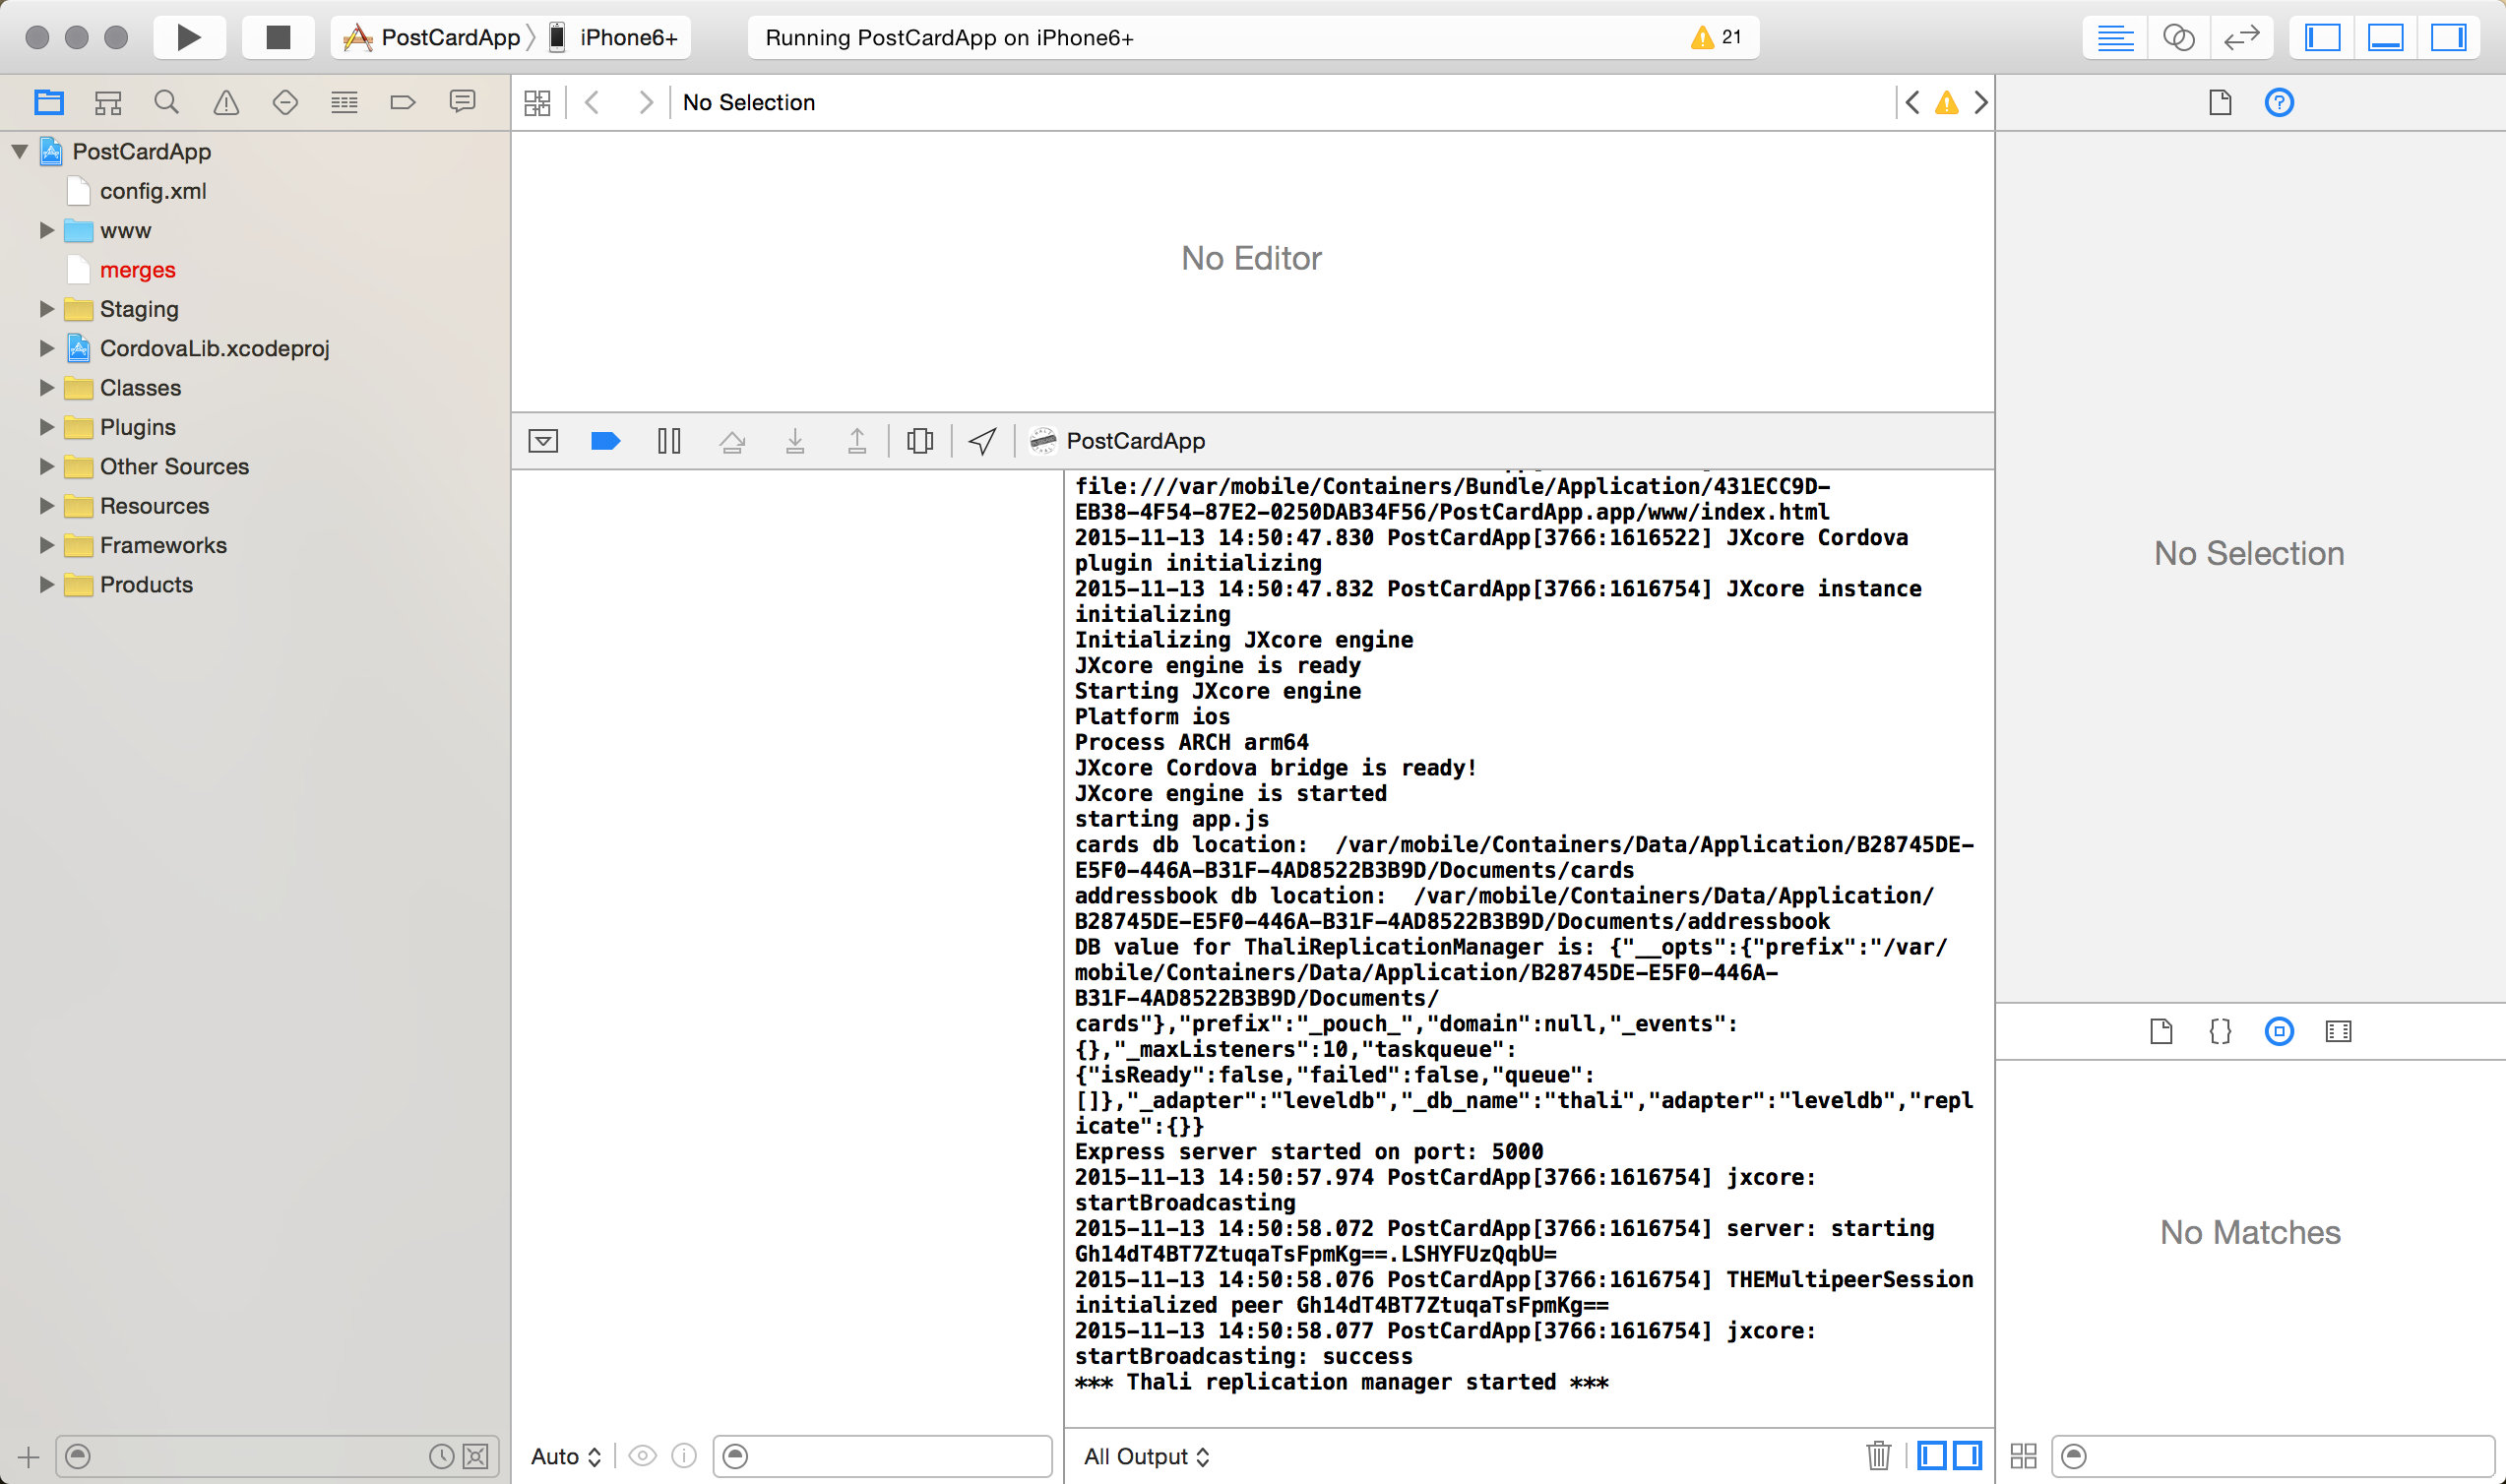
Both these options allow you to run and debug multiple devices although you have to tab or switch views to see the other devices logs. Also Android logs are so noisy it’s almost impossible to spot the stuff you want to look at. Ideally I would like to look at all logs at the same time and dial in on the stuff I’m really interested in.
While developing the Postcard app I mocked up the UX flow to perform an Identity Exchange with two devices using our peer to peer Thali Cordova plugin for iOS and Android. Needless to say the Android logs got very busy and I also wanted to be able to get the logs of iOS devices outside of Xcode sessions. Thankfully there are a couple of better ways to debug multiple Android and iOS devices from one Mac —
Debugging Cordova web apps on multiple Android devices using adb and logcat filtering
List android devices attached:
adb devices
Because I have two android devices attached I want to be able to target both from command line.
cordova run android --debug --target=ZX1C224H9F
cordova run android --debug --target=YT91138019
Once Cordova has installed the app on device you can use logcat to see the logs in Terminal. However with multiple devices you want to use adb -s to target a device and then use logcat -s to filter out all the noise! With the Postcard app we are using jxcore to run Node.js on mobile so I used ‘jxcore-log:*’ as my filter.
adb -s YT91138019 logcat -s jxcore-log:\*
In another Terminal tab or split window in iTerm.
adb -s ZX1C224H9F logcat -s jxcore-log:\*
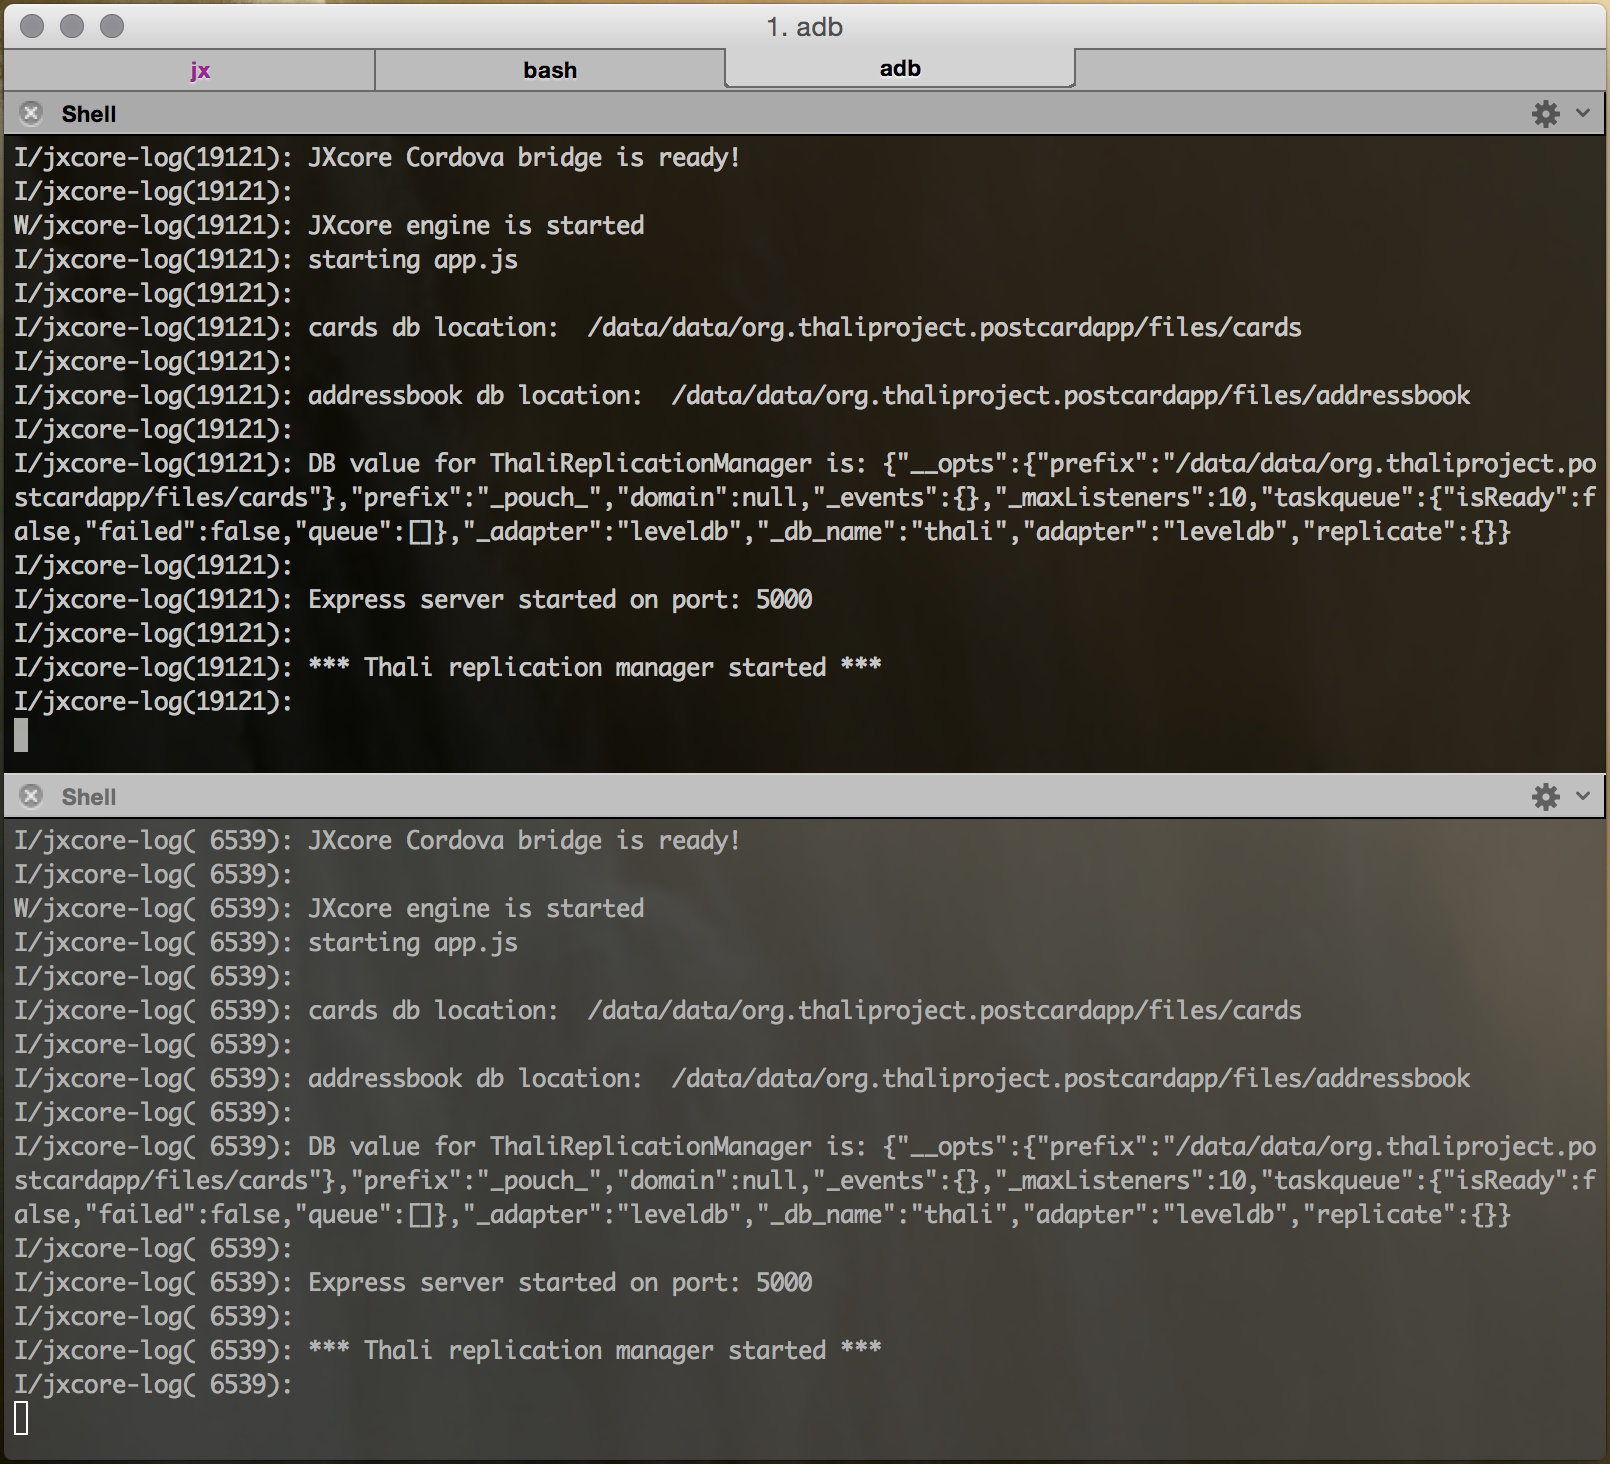
Now that’s much cleaner and stuff doesn’t scroll faster than you can actually read! ;)
Assuming the Android device is already developer enabled you can also inspect the web view and javascript console logs in Chrome: chrome://inspect/#devices
Debugging Cordova web apps on multiple iOS devices using iOS Console
With iOS all you need to do is attach your devices and download iOS Console which is a handy freeware app to view iOS logs on a Mac with filtering. With our iOS Postcard app I have set the filter to ‘jxcore’.
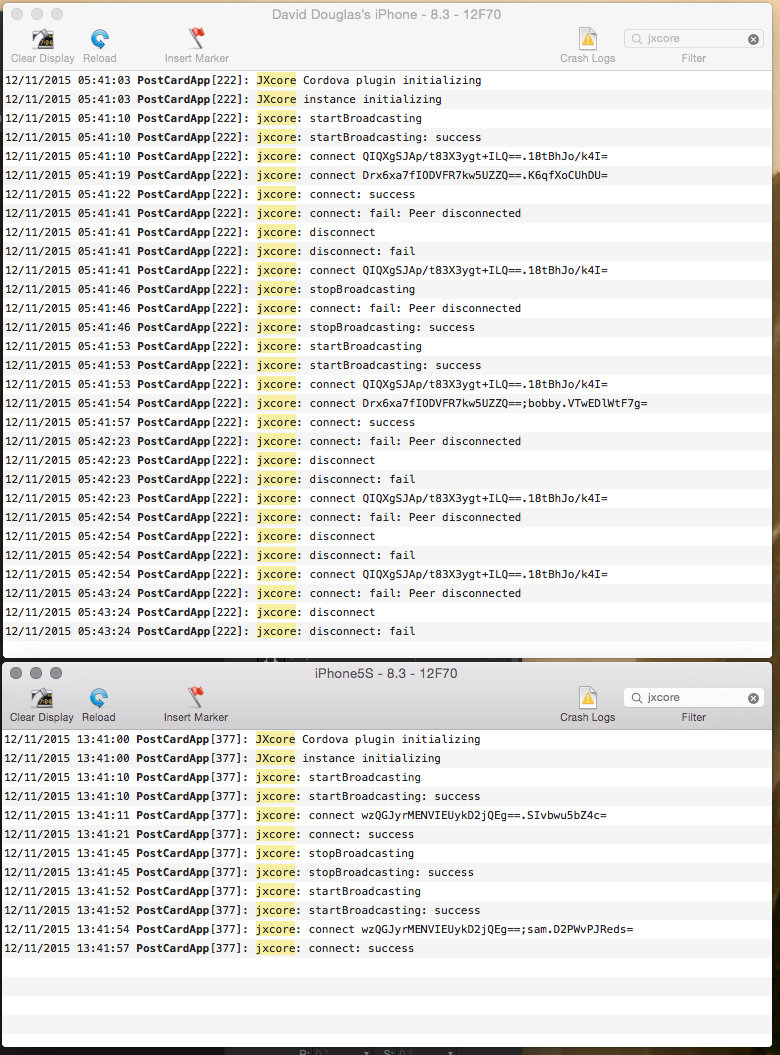
iOS Console doesn’t need Xcode running and the logs are a lot cleaner than the default Console app.
Also you can inspect the web view and javascript console in Safari once the app is running. In Safari browser go to:
Safari > Preferences > Advanced and turn on “Show Develop menu in menu bar” then select:
Safari > Developer > Device Name
Note: If you are using mobile Safari to test your web app instead of Cordova then you will have to enable “Web Inspector” on the iOS device under Settings > Safari > Advanced